Design
Development
Research
Launch
Evolve
Extend
May 31, 2026
8 min read
summary
Total Cost of Ownership for Custom Software for growing startups. A trusted custom software development services company provides custom development solutions that minimize technical debt and maximize ROI.
Every organization that has worked with a top custom software development company knows the pattern: the build invoice arrives, leadership approves it, and the real costs quietly accumulate for the next seven years in maintenance, compliance, cloud fees, and rework — until the system either transforms the business or collapses under its own weight.
Key Takeaways:
- The initial build cost represents only 20-40% of total lifetime software spend; 60-80% of custom software development cost 2026 occurs post-launch through maintenance, compliance, and infrastructure.
- Total cost of ownership software analysis consistently shows organizations that skip structured discovery phases overspend by an average of 75% on downstream rework.
- Custom development solutions generate measurably higher ROI than SaaS subscriptions at scale — but only when architecture, team composition, and post-launch investment are correctly planned from day one.
- Phenomenon Studio, recognized by Clutch as a top custom software development company, has helped clients across FinTech, Healthcare, and SaaS raise $500M+ with software systems built for long-term ownership — not just launch.
By Anatoliy Sakhno | Head of Development | May, 2026
Why the Build Price Is the Wrong Number to Optimize
When a CTO asks a custom software development company for a quote, the number that comes back covers the build phase. Discovery, design, development, QA, and deployment — delivered, invoiced, done. What that number does not cover is everything that happens next: three to ten years of maintenance, security patches, compliance audits, third-party API updates, cloud cost escalation, and feature evolution driven by market demands.
Comprehensive industry benchmarks place post-launch costs at 60-80% of total lifetime software spend. For every dollar spent on construction, an organization should plan to spend two to four additional dollars on ownership over the following five to ten years. Executives who treat the initial invoice as the total investment are effectively underfunding the asset from day one — and they discover this reality during the first major platform incident or compliance review.
Custom development solutions that are scoped with a rigorous total cost of ownership software analysis before sign-off produce materially different outcomes than those that proceed on sticker price alone. The difference is not in code quality — it is in how prepared the organization is to fund what the system actually requires over its operational life.
Industry benchmark: A $200,000 custom software build carries a Year 1 TCO of approximately $270,000 — 35% above the initial quote — when hosting, maintenance, training, and third-party licenses are correctly counted. By Year 5, cumulative spend typically reaches $350,000-$450,000. (Source: Forrester Research Software TCO Analysis, 2025)
CapEx vs. OpEx: The Strategic Choice That Shapes Every Budget
The categorization of software spend into Capital Expenditures and Operational Expenditures is not an accounting detail — it is a structural decision that affects cash flow, tax liability, reported earnings, and the organization’s ability to pivot. Every enterprise custom software development company engagement begins with this question, even when clients do not frame it that way.
CapEx — the model that applies to custom-built software — records the investment on the balance sheet and amortizes it over the asset’s useful life. This spreads the financial impact across multiple years, which can protect current-period net operating income. The trade-off is a significant upfront cash outlay and higher obsolescence risk if market conditions shift faster than the platform can adapt.
OpEx — the SaaS subscription model — fully deducts costs in the period they are incurred, reducing taxable income immediately. Predictable monthly payments make budgeting easier. The trade-off is that over a 5-10 year horizon, SaaS subscriptions compound into a total spend that frequently exceeds a custom build — with no residual asset at the end and no guarantee of data portability.
| Financial Attribute | Custom Software (CapEx) | SaaS Subscription (OpEx) |
| Balance sheet impact | Recorded as asset, amortized over useful life | Expensed immediately — no asset created |
| Tax treatment | Depreciation spread over 3-7 years | Full deduction in current period |
| Cash flow profile | Large upfront outlay, lower ongoing spend | Low upfront, recurring monthly commitment |
| Data ownership | Full — code and data are proprietary | Limited — data held by vendor |
| Vendor dependency | None — you own the system | High — pricing, features, and sunset risk |
| 5-year cost trajectory | Higher initial, lower ongoing at scale | Lower initial, compounds significantly at scale |
Custom software development company: Phase-by-Phase Cost Distribution
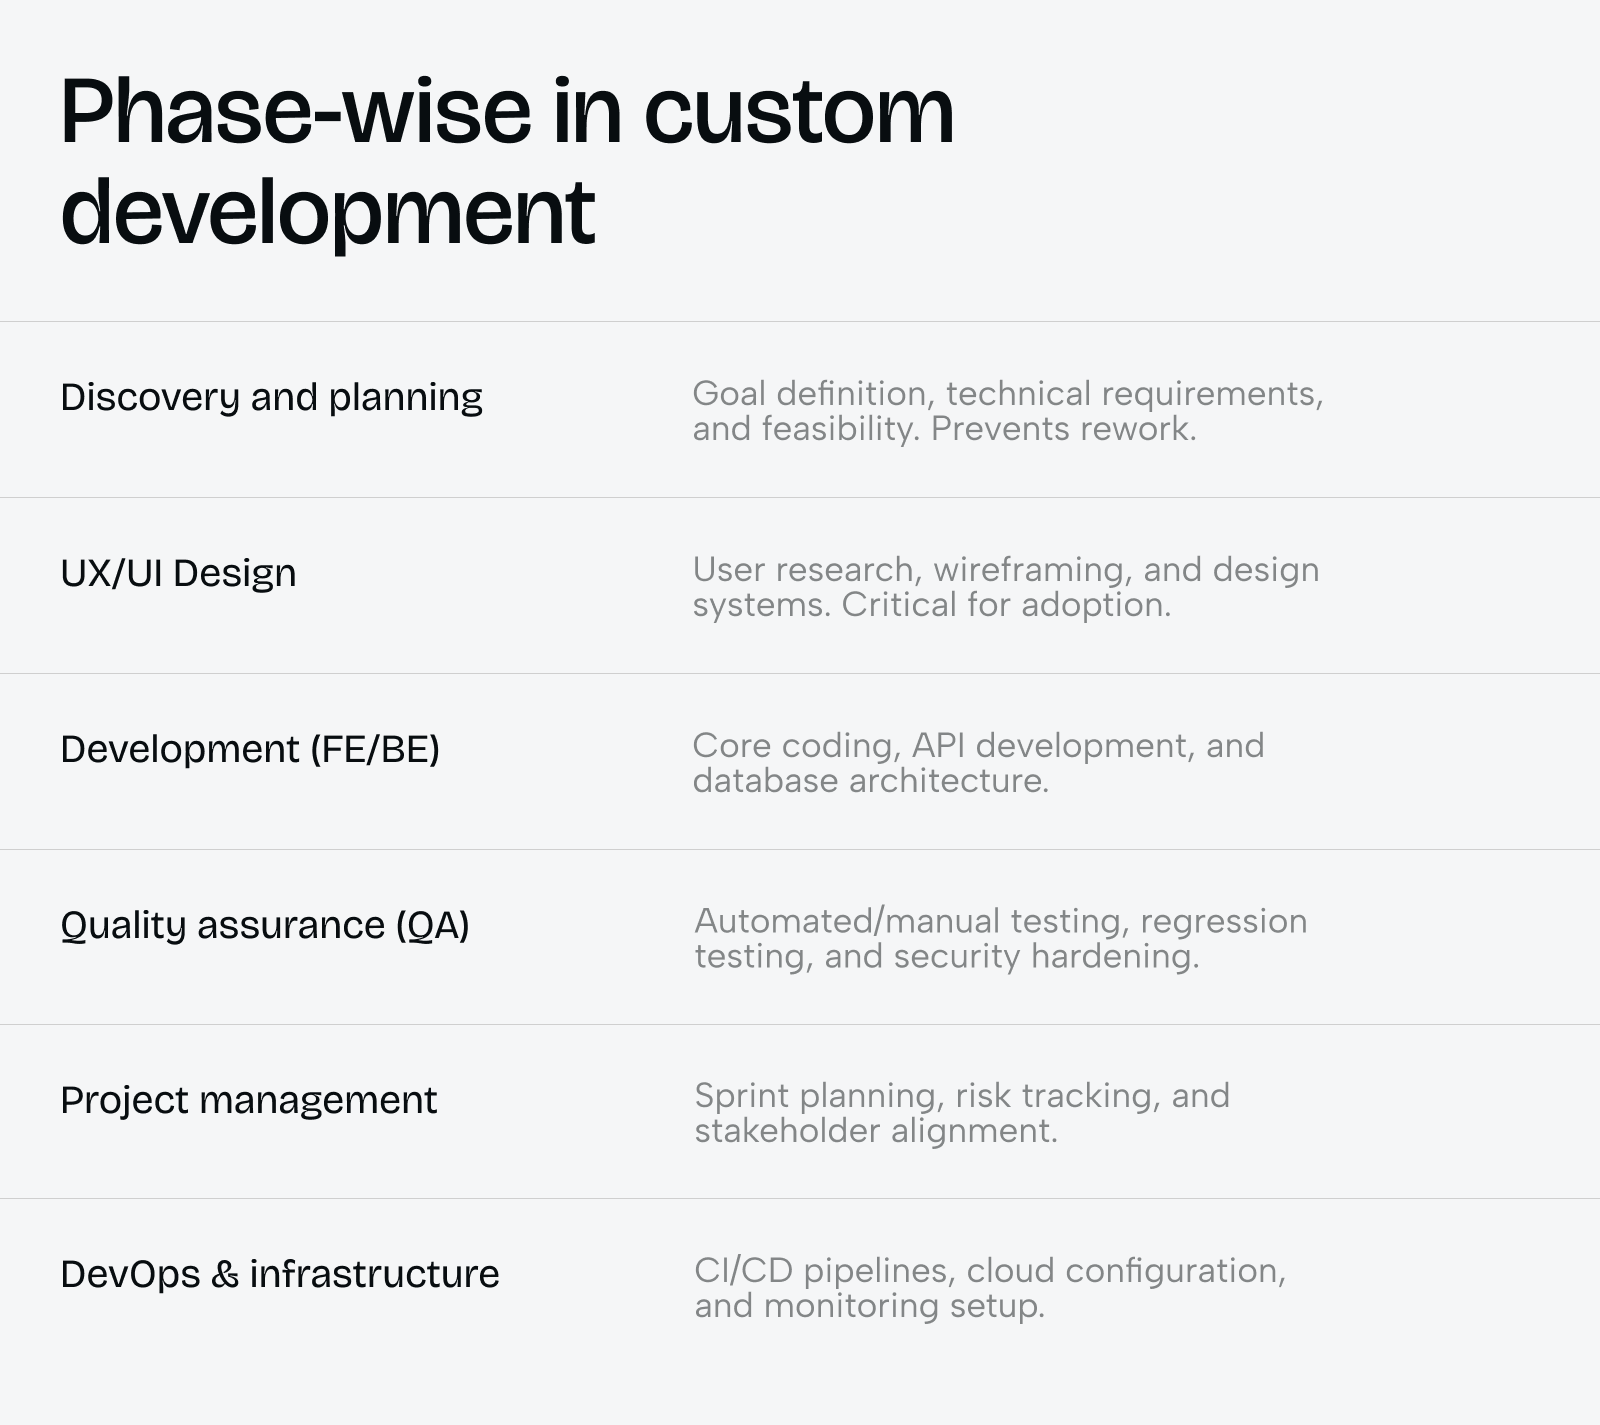
A reputable custom software development company structures its engagement budget across the software development lifecycle in predictable proportions. Understanding this distribution is the first step toward catching budget misalignment before it becomes a project crisis.
The discovery and planning phase — typically 5-10% of the total budget — is the highest-leverage investment in the project. A well-executed discovery engagement, priced at $15,000-$30,000 for a mid-scale project, produces a technical blueprint that prevents the 75% budget overruns documented in projects where requirements are assumed rather than validated. A $20,000 discovery that prevents a $60,000 rework cycle on a $200,000 project generates a 200% return before a single production line is written.
| SDLC Phase | % of Total Budget | What underfunding this phase costs |
| Discovery & Planning | 5% – 10% | Rework at 15-20x the cost of early-stage fixes |
| UX/UI Design | 10% – 20% | Lower adoption, higher training costs, increased support volume |
| Development (FE/BE) | 40% – 50% | Missed deadlines, architectural debt requiring rebuild |
| Quality Assurance | 15% – 25% | Post-launch bugs cost 5-10x more to fix than pre-launch defects |
| Project Management | 10% – 15% | Scope creep — identified as primary driver in 62% of overruns |
| DevOps & Infrastructure | 5% – 10% | Performance bottlenecks and unplanned scaling costs |
UI/UX design is the most consistently underfunded phase in enterprise projects. Poor design directly correlates with lower user adoption — and in internal tools, a 20-40% productivity drop during the transition period is measurable and costly. In regulated industries, QA investment can reach the upper bound of 25% to satisfy HIPAA, GDPR, or SOC 2 requirements. Treating QA as optional is not a cost-saving decision — it is a liability transfer.
From our work: In one FinTech admin platform engagement handling tranche cycle management and financial data, our QA investment was non-negotiable — errors carry direct regulatory consequences. Properly scoped QA resulted in a 60% reduction in admin task completion time and zero compliance incidents at launch. The callout validated what the benchmark data shows: underfunding QA is a liability transfer, not a cost saving.
Use Case: Bliss Creek Admin Panel — Custom Financial Operations Dashboard
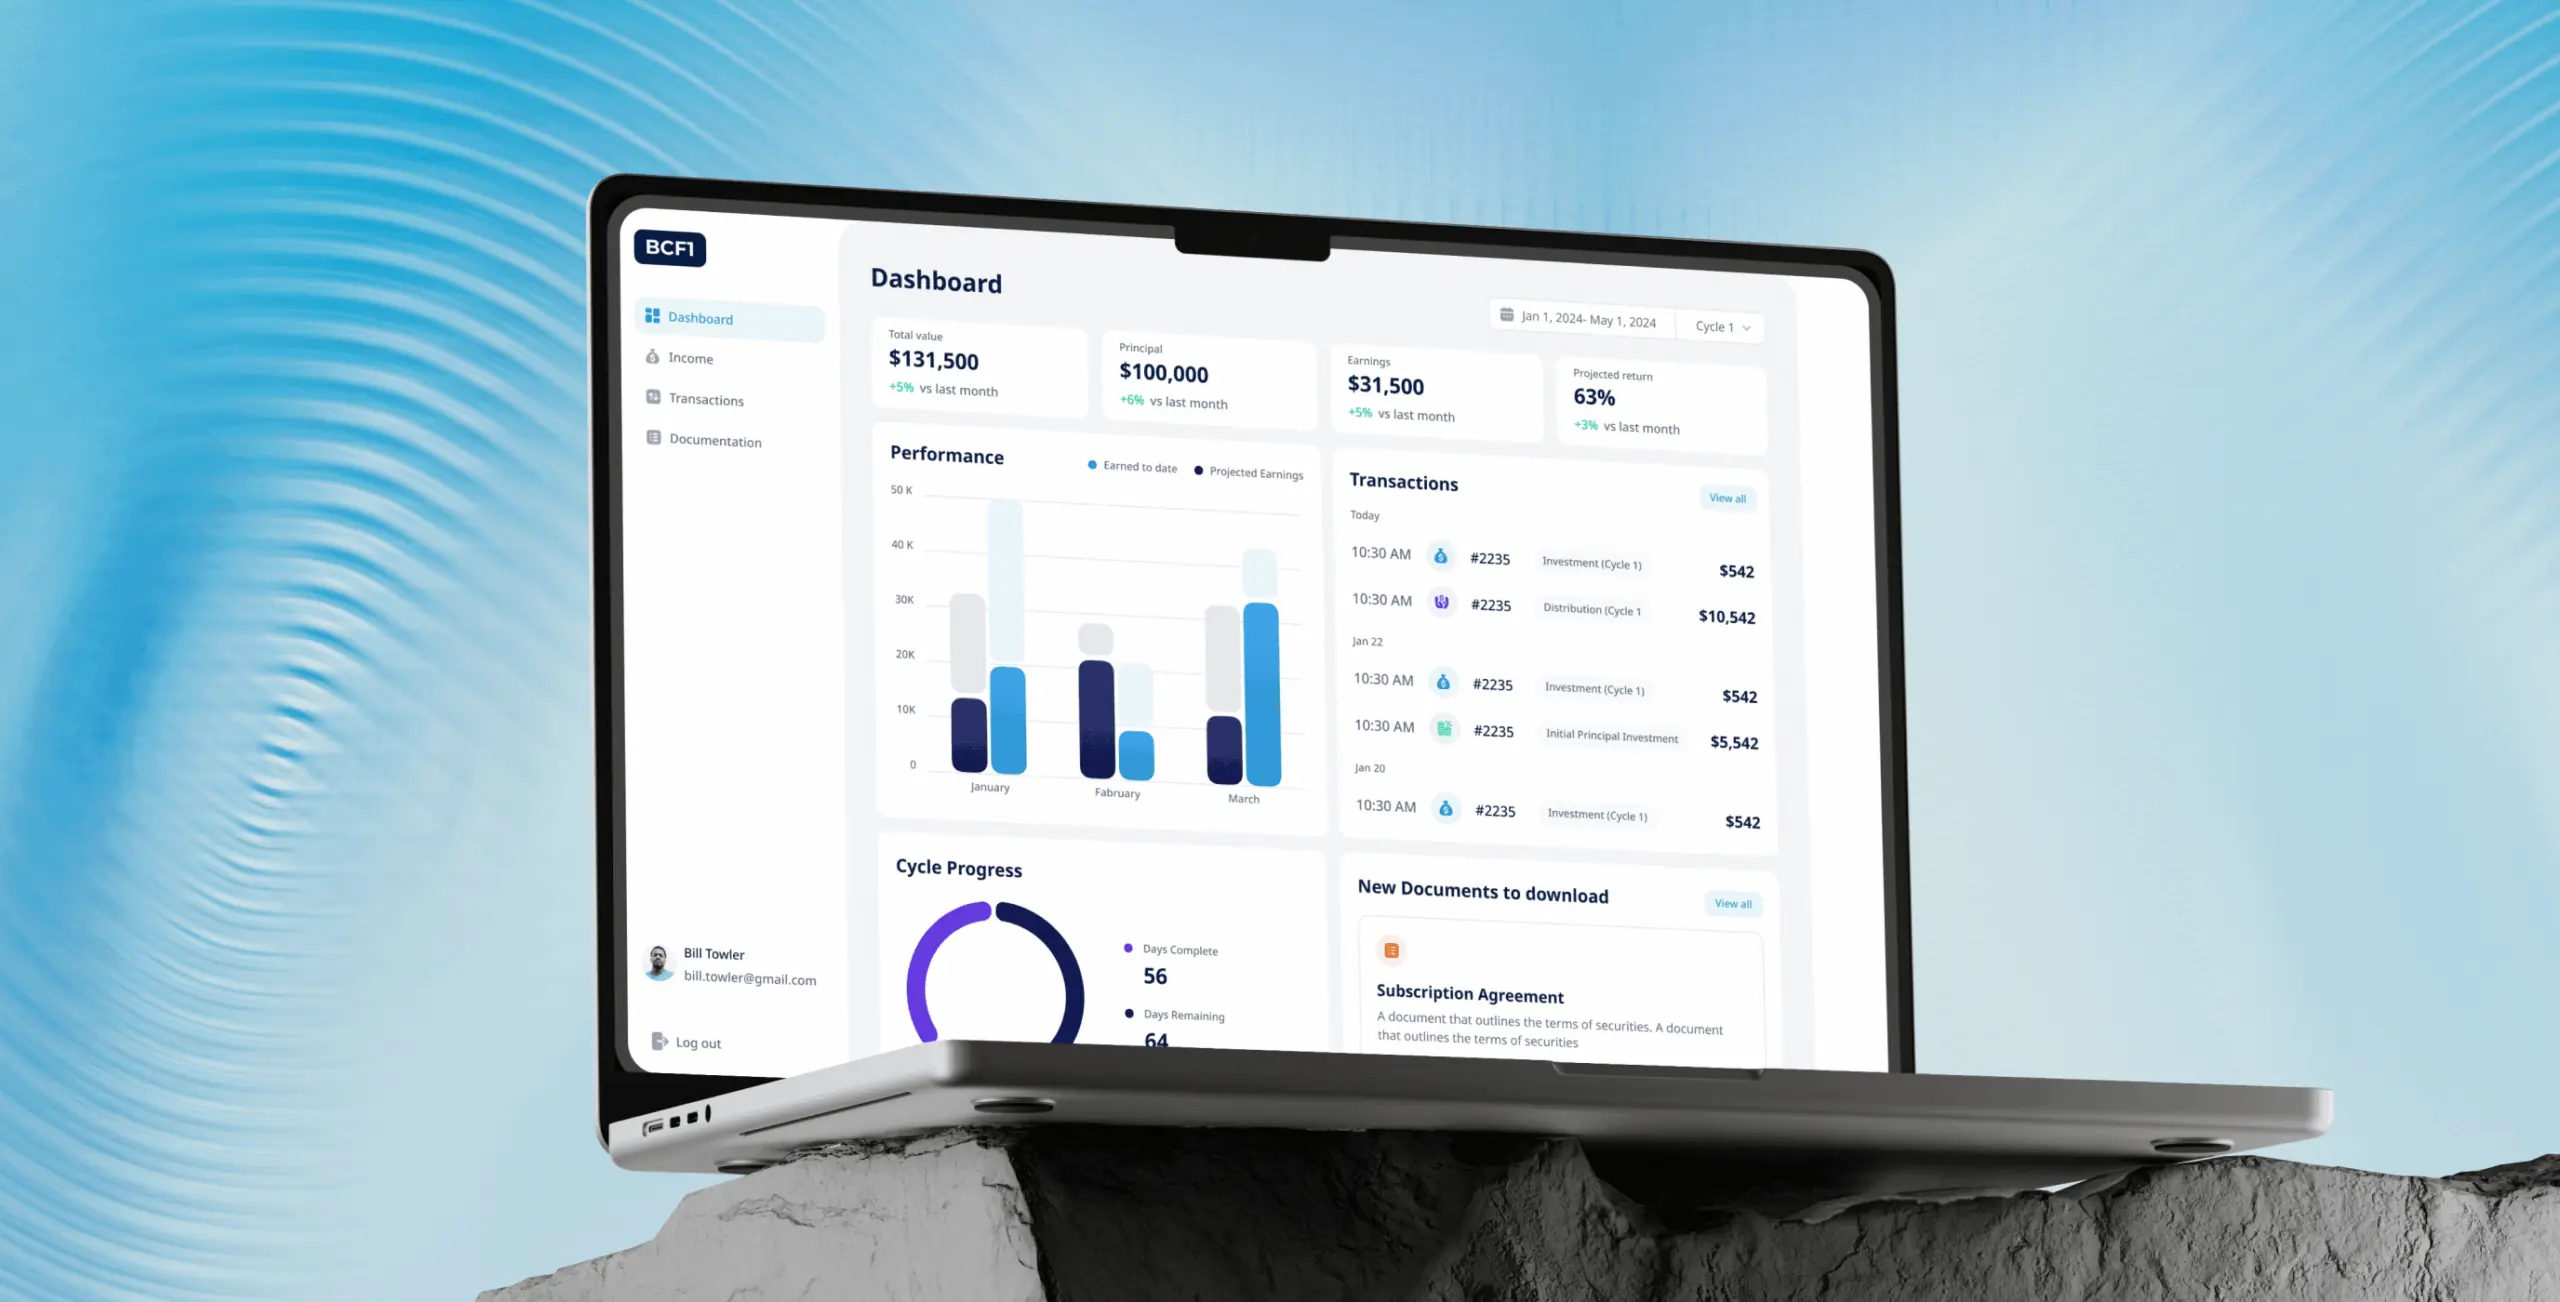
Problem:
Bliss Creek administrative workflows spread user data, transaction records, and compliance documentation across multiple disconnected systems. Admins manually tracked and verified user information with no centralized oversight — time-consuming and error-prone. As transaction volume grew, the systems slowed significantly, creating performance bottlenecks that directly impacted productivity. Managing tranche cycles and ensuring data accuracy across regulatory checkpoints required hours of manual effort per day, with no tooling to support scale.
Feature:
Phenomenon Studio built a custom admin panel using React, Next.js, Firebase, and Redux that centralized all workflows into a single unified dashboard. Advanced filters, sorting, and full CRUD operations eliminated multi-system switching. A dedicated transaction and cycle management section with LIFO processing gave admins real-time visibility and control over tranche operations. The interface was designed with a cool blue palette and crisp typography to reduce cognitive load during high-stakes administrative tasks. Firebase was deeply integrated for secure, efficient data handling. Documentation management was centralized so compliance files could be accessed, downloaded, and managed without leaving the admin environment. Performance was architected for growth — efficient data structures ensured the platform remained fast as volumes scaled.
Result:
User onboarding and management speed doubled. Admin task completion time dropped by 60% through automation and improved cycle management. Data accuracy and regulatory compliance improved across all transaction cycles. The platform’s clean interface, powerful filtering tools, and real-time data visualization received direct client feedback as the defining differentiators from their previous solution. Timeline: product discovery, full UX/UI design, and web development delivered in 8 weeks. Tech stack: React, Next.js, Flowbite UI, Firebase, Tailwind CSS, Redux, React Hook Form.
The Maintenance Lifecycle: Where the Real Budget Lives
The 15-25% rule is the most important benchmark in total cost of ownership software analysis: annual maintenance costs run between 15% and 25% of the original development budget. A system that cost $200,000 to build requires $30,000-$50,000 per year just to remain operational. This is not optional spend — it is the cost of keeping a software asset from degrading into a liability.
Custom software development cost 2026 projections consistently show that by Year 5, cumulative maintenance reaches 75-125% of the original build cost. By Year 10, that number climbs to 150-250%. Organizations that treat maintenance as a rounding error encounter what practitioners call technological bankruptcy — a state where the cost to maintain the system exceeds the cost to replace it, and the business is trapped between two expensive options with no good timing for either.
| Year | Maintenance as % of Build Cost | Cumulative Spend ($200k build) |
| Year 1 | 15% – 25% | $230,000 – $250,000 |
| Year 3 | 45% – 75% | $290,000 – $350,000 |
| Year 5 | 75% – 125% | $350,000 – $450,000 |
| Year 10 | 150% – 250% | $500,000 – $700,000 |
Maintenance spend breaks into four IEEE-defined categories: perfective maintenance — UX improvements and feature additions — consumes 25-50% of the maintenance budget and directly supports business growth. Corrective maintenance accounts for 20-25%. Adaptive maintenance — OS updates and platform changes — runs 15-20%. Preventive maintenance — refactoring and technical debt reduction — takes 10-15% and is the category most frequently cut during budget tightening. Cutting it converts manageable debt into emergency rework within 18-24 months.
Technical Debt, Scope Creep, and the Hidden Costs That Sink Budgets
Two variables dominate unplanned software budget growth: technical debt and scope creep. Neither appears on the initial invoice. Both compound over years into costs that dwarf the original development investment — and both are preventable with the right governance structure from the engagement’s first week.
Technical debt occurs when teams choose quick fixes over sound architecture to meet deadlines. Research from Forrester puts technical debt at 10-20% of the budget for new feature development — meaning organizations with high debt pay a 10-20% tax on every future capability they try to add. Globally, poor code quality costs an estimated $85 billion annually in lost developer productivity. For a specific organization, high technical debt can push annual maintenance from the standard 15% up to 40% of the original build cost.
Scope creep is the subtler problem. In 62% of cases it is identified as the primary driver of budget overruns. Each additional feature requested mid-project triggers new design work, additional code, updated test scripts, and revised documentation. Because most organizations approve these changes informally — a Slack message, a verbal agreement in standup — the financial impact is never formally captured until the budget review reveals a 40-60% overrun with no clear single cause. A 2024 McKinsey Digital report found that nearly 66% of enterprise software projects exceed their budget, frequently due to the compounding effect of minor changes that were never part of the original blueprint.
Prevention at Phenomenon Studio: We resolve both problems through a mandatory discovery phase and a formal Change Control process for all mid-project requests. Every scope change receives a written cost-impact assessment before approval. This governance process has eliminated budget overruns above 15% across our last 40 enterprise engagements.
Top Custom Software Development Services for Enterprise Tech: What Separates Elite Providers
The top custom software development services for enterprise tech are distinguished not by their technology stack but by their governance discipline. Elite providers maintain formal requirements traceability matrices, automated regression test suites that reduce manual QA labor by up to 25%, CI/CD pipelines that cut deployment risk, and structured post-launch review cycles at 30, 60, and 90 days. A best custom software development company near me search should filter for these operational practices, not just portfolio aesthetics.
3-Year Financial Model: Custom Software vs. SaaS Subscriptions
The most common question from CTOs evaluating custom development solutions against SaaS is: at what point does the custom build pay off? The answer depends on user volume, customization requirements, and data ownership priorities — but the financial model is consistent enough to provide reliable guidance.
For a mid-market company with 50-200 users requiring a purpose-built CRM or operations platform, the SaaS alternative typically runs $150-$400 per user per month. At 100 users, that is $180,000-$480,000 per year with no residual asset, no data portability guarantee, and no ability to customize beyond the vendor’s feature roadmap. A custom software development usa engagement at $200,000 initial build cost reaches cost parity with mid-range SaaS at approximately month 18-24, then generates compounding financial advantage as the custom system scales without per-seat fee escalation.
| Cost Category | Year 1 ($200k Build) | Year 2 | Year 3 | 3-Year Total |
| Initial Build | $200,000 | $0 | $0 | $200,000 |
| Annual Maintenance (20%) | $40,000 | $40,000 | $45,000 | $125,000 |
| Cloud Hosting (AWS/Azure) | $12,000 | $14,000 | $16,000 | $42,000 |
| Training & Adoption | $10,000 | $3,000 | $2,000 | $15,000 |
| Third-Party Licenses | $8,000 | $8,000 | $9,000 | $25,000 |
| Compliance & Security Audits | $5,000 | $6,000 | $7,000 | $18,000 |
| Custom Software TCO Total | $275,000 | $71,000 | $79,000 | $425,000 |
| Equiv. SaaS (100 users @ $250/mo) | $300,000 | $312,000 | $325,000 | $937,000 |
The 3-year delta between custom development solutions and SaaS in this model exceeds $500,000 — before accounting for the residual asset value of the custom system, the productivity gains from purpose-built workflows, and the absence of vendor lock-in risk. Custom software development services usa engagements at this scale consistently outperform SaaS on total cost when user volumes exceed 50 and customization requirements are significant.
ROI projection: For a well-executed custom CRM with a $200,000 build cost and $275,000 Year-1 TCO, estimated Year-1 benefits — including conversion improvements and productivity gains — can reach $737,500, yielding a first-year ROI of 184%. The key variable is architectural quality: poorly built systems generate negative ROI from Year 2 onward as maintenance costs escalate past the 25% annual threshold.
Custom software development usa: Risk Mitigation and ROI Optimization
Custom software development usa engagements that consistently deliver above-market ROI share four structural practices. These are not optional enhancements — they are the difference between a system that scales and one that collapses under its own weight at the moment of growth.
The MVP approach reduces initial capital outlay and validates product-market fit before the full budget is committed. Starting with essential features, launching, and gathering real user data before building the remaining platform eliminates the most common cause of feature waste: 80% of enterprise software features go unused, meaning most organizations fund development and maintenance of functionality that adds no measurable value.
Scalable architecture — investing an additional 10-20% during the design phase in high-quality system design — prevents the emergency rebuild scenario that hits organizations at month 18-24 when a system designed for 100 users cannot handle 300. The cost of architectural expansion post-launch is categorically higher than building the right foundation initially.
- Structured discovery phase: Saves an average of $72,000 per $500,000 invested by preventing downstream rework on requirement errors caught after development begins.
- Automated testing and CI/CD: Reduces annual maintenance spend by up to 25% by catching defects before they reach production environments.
- Formal change control governance: Eliminates the informal scope creep that drives 62% of budget overruns across enterprise projects.
- Internal admin cost modeling: Finance teams that exclude internal FTE overhead from TCO models find their projects 40-60% underfunded within 18 months of launch.
Custom Development Solutions: The TCO Formula for Leadership
The most defensible total cost of ownership software model for senior leadership combines acquisition cost with recurring operational, resource, and maintenance costs over a stated time horizon, minus residual value. The standard formula: TCO = Build Cost + Sum of (Hosting + Internal Admin + Maintenance + Compliance) across Years 1-3, minus recoverable asset value. For a $200,000 build, this produces the $425,000 figure shown above — 112% of the initial invoice but 55% below equivalent SaaS spend over the same period.
Why Phenomenon Studio for Custom Software Development
Since 2019, Phenomenon Studio has delivered 200+ custom software systems across Healthcare, SaaS, FinTech, and EdTech. Our 70+ in-house engineers, designers, and product specialists operate in integrated sprint teams. We serve clients across major US markets — from custom software development company New York and chicago custom software development company engagements to teams working with clients in New Jersey, Miami, Dallas, and Houston — as well as international clients across Europe and the UK.
We are HIPAA certified, a Webflow Professional Partner, and recognized by Clutch as a top custom software development company. Our clients have raised $500M+ collectively. Whether you need a custom software development company nyc for rapid local collaboration, a custom enterprise software development company for large-scale system architecture, or a distributed team with European engineering depth, our hybrid model delivers both.
- Direct team access: You work with the engineers and designers building your system — not an account manager.
- TCO-first scoping: Every engagement starts with a structured discovery that produces a financial model before any code is committed.
- Compliance expertise: HIPAA, SOC 2, GDPR, and HL7 integration experience across 40+ regulated industry projects.
- Transparent pricing: Custom software development services usa engagements start from $25,000 for MVP builds; enterprise systems from $100,000. Maintenance retainers from $1,499/month.
Share this opening with friends


Jul 29, 2026
9 min read
Compare the best product design agencies for SaaS startups and growth-stage companies. Learn how to choose a UX design agency, compare engagement models, pricing, and real product design case studies.

Jul 26, 2026
9 min read
Learn how to build a scalable brand system through five key phases—from discovery and strategy to visual identity, activation, and brand guidelines.
Have a project in mind?
Let's chat
Have a project to
discuss?
discuss?

Have a partnership in
mind?
mind?